Financial Ratio Analysis
Recap Summary From Last Module (Financial Ratio Analysis)
Income Statement of Burger Joint
For the year ended xxxx
Particulars
Amount
Particulars
Amount
Cost of Raw Materials Rent & Electricity
Salary of Staffs
Salary of Manager
Equipment Cost
Gross Profit
Less: Tax
Net Profit
$12000
$12000
$12000
$24000
$20000
$110000
$10000
$100000
Sales/Revenue
$190000
Balance Sheet
As at 31st March, xxxx
Liabilities
Amount
Assets
Amount
Account Payable
Owner Equity
$20000
$100,000
Cash in Bank
Equipment
$100,000
$20000
Total
$120000
Total
$120000
Equity refers to the amount the owner or shareholder of the business employs in his business.
Earnings per Share (EPS)
Earnings per Share (EPS) is a metric that measures a company’s profitability. EPS is calculated by dividing a company’s net income by the number of its outstanding shares of common stock.
Formula
EPS = Net income of the company/No. Of shares of the company
= $100,000/10,000
= $10
Return on Assets
ROA is a metric that measures the efficiency of a company in generating profits from its assets. Return on total assets tells investors how much profit the company is earning in relation to its total assets.
Formula
Return on Assets = Net Income / Total Assets
Example
The total asset held by Burger Joint was $120000, whereas the income made was $100,000.
Therefore, the Return on Asset of Burger Joint = Net Income / Total Assets
=($100000/$120000)*100
= 83%
Every $1 that George invested in his assets yielded him $.83. It also indicates how well a company uses its assets to generate earnings.
Return on Equity
ROE is a metric that measures the efficiency of a company in generating profits from its shareholder’s equity.
As the name of the ratio itself suggests, this ratio measures how much return the company owner earns on his equity.
This shows the capability of the company to generate profits on its net capital employed in the business.
Formula
Stockholder’s Equity=Total Assets − Total Liabilities
So, Return on equity = Net Income / Shareholder’s equity.
Example
In George’s burger joint, his equity was $100,000, whereas the business’s net income or net earnings was $100,000.
ROE of Burger Joint = ($100000/$100000)*100
= 100%
This means out of the total capital which George has invested in the company, he can earn a return of 100% per annum.
Debt-to-Equity (D/E) Ratio
The D/E ratio is a metric that compares a company’s total debt to its total equity.
Debt refers to the long-term loans a company takes to meet the capital requirements of the business. A high D/E ratio can indicate that a company is highly leveraged, which can increase its risk of default. Higher value makes it more vulnerable to financial difficulties if its earnings decline or its debt servicing costs increase. (Financial Ratio Analysis)
Formula
Debt/Equity=
Total Shareholders’ Equity
Total Liabilities
Example
George does not have any debt so the ratio would be 0. An ideal company is one whose debt-to-equity ratio is 0, i.e., it has no long-term debt and no financial commitments to pay.
= $0 / $100,000
= 0
In case of excess debt, the company must pay off the interest on the loan and the principal amount out of profits. This reduces the dividend for shareholders or retained earnings for the company’s future growth.

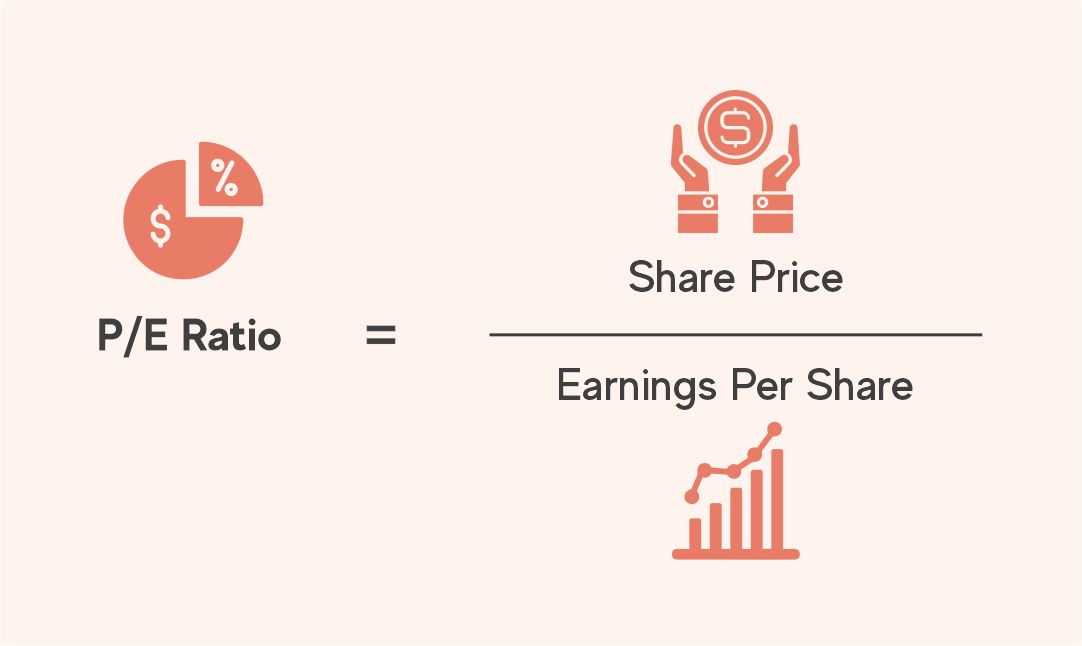
Price-to-Earnings (P/E) Ratio
P/E) ratio is a metric that compares a company’s stock price to its earnings per share (EPS).
Price refers to the market price of the share, and earnings refer to the net income earned by each shareholder of the company.
Formula
P/E= Market Price of stock/Earning per share
Example
Let us go back to George’s burger Joint example, where the stock price was $100 and earnings made per share was $100.
Therefore, Price to earning ratio of Burger Joint = Market Price of stock / Earnings per share
= $100/$100
= 1.
This means for every 1 dollar George invested in Burger Joint; he earned $1 at the end of the year. P/E ratio also tells you how many years it will take to get the money back if the profit remains same.
It’s important to note that the P/E ratio can vary widely depending on the industry sector. For example, the technology sector companies, which are often high-growth, typically have a higher P/E ratio than companies in the mature sector, like banking, which generally have a lower P/E ratio. (Financial Ratio Analysis)

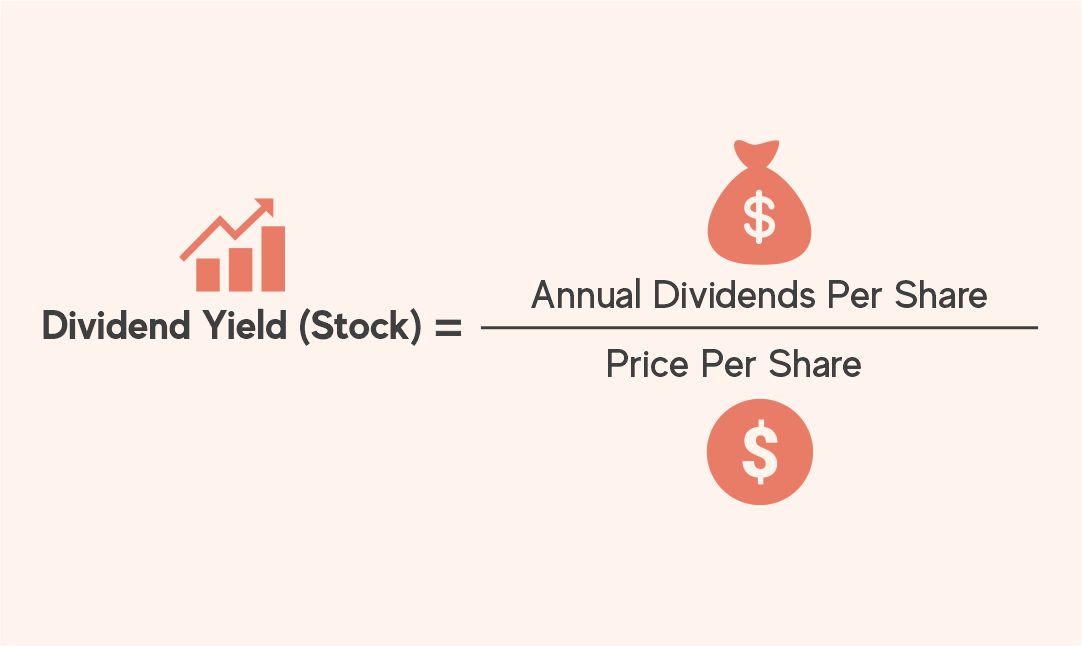
Dividend Yield Ratio
The Dividend Yield ratio is a metric that measures the amount of income generated by a company’s dividends as a percentage of its stock price.
The term “Yield” refers to returns.
A dividend refers to the part of the profit distributed among the shareholders.
The dividend yield ratio tells you how much dividend a share gives on its market price.
Formula
Dividend Yield = Annual Dividends Paid Per Share
Market Price Per Share
Example
In George’s burger Joint, the market price of the share was $100, and the dividend that which company provided to shareholders was $60000/1000 =$60.
Therefore, the dividend yield ratio for Burger Joint = (Dividend/Market price)*100
= ($60/$100)*100
= 60%

Price-to-Book (P/B) Ratio
The Price-to-Book (P/B) ratio is a metric that compares a company’s stock price to its book value.
The value of a company’s assets is listed on its balance sheet. In a practical scenario, it indicates if we liquidate(sell) all the assets of a company, how much will it earn?
Formula
P/B Ratio= Market Price per Share
Book Value per Share
A low P/B ratio can indicate that a stock is undervalued, while a high P/B ratio can indicate that a stock is overvalued.
These are just a few key examples of financial ratios that can be useful in different scenarios for evaluating a company’s financial health & performance.
Recap Summary From Last Module (Financial Ratio Analysis)
Income Statement of Burger Joint
For the year ended xxxx
| Particulars | Amount | Particulars | Amount |
| Cost of Raw Materials Rent & Electricity
Salary of Staffs Salary of Manager Equipment Cost Gross Profit Less: Tax Net Profit |
$12000
$12000 $12000 $24000 $20000 $110000 $10000 $100000 |
Sales/Revenue | $190000 |
Balance Sheet
As at 31st March, xxxx
| Liabilities | Amount | Assets | Amount |
| Account Payable
Owner Equity |
$20000
$100,000 |
Cash in Bank
Equipment |
$100,000
$20000 |
| Total | $120000 | Total | $120000 |
Equity refers to the amount the owner or shareholder of the business employs in his business.
Earnings per Share (EPS)
Earnings per Share (EPS) is a metric that measures a company’s profitability. EPS is calculated by dividing a company’s net income by the number of its outstanding shares of common stock.
Formula
EPS = Net income of the company/No. Of shares of the company
= $100,000/10,000
= $10
Return on Assets
ROA is a metric that measures the efficiency of a company in generating profits from its assets. Return on total assets tells investors how much profit the company is earning in relation to its total assets.
Formula
Return on Assets = Net Income / Total Assets
Example
The total asset held by Burger Joint was $120000, whereas the income made was $100,000.
Therefore, the Return on Asset of Burger Joint = Net Income / Total Assets
=($100000/$120000)*100
= 83%
Every $1 that George invested in his assets yielded him $.83. It also indicates how well a company uses its assets to generate earnings.
Return on Equity
ROE is a metric that measures the efficiency of a company in generating profits from its shareholder’s equity.
As the name of the ratio itself suggests, this ratio measures how much return the company owner earns on his equity.
This shows the capability of the company to generate profits on its net capital employed in the business.
Formula
Stockholder’s Equity=Total Assets − Total Liabilities
So, Return on equity = Net Income / Shareholder’s equity.
Example
In George’s burger joint, his equity was $100,000, whereas the business’s net income or net earnings was $100,000.
ROE of Burger Joint = ($100000/$100000)*100
= 100%
This means out of the total capital which George has invested in the company, he can earn a return of 100% per annum.
Debt-to-Equity (D/E) Ratio
The D/E ratio is a metric that compares a company’s total debt to its total equity.
Debt refers to the long-term loans a company takes to meet the capital requirements of the business. A high D/E ratio can indicate that a company is highly leveraged, which can increase its risk of default. Higher value makes it more vulnerable to financial difficulties if its earnings decline or its debt servicing costs increase. (Financial Ratio Analysis)
Formula
Debt/Equity=
Total Shareholders’ Equity
Total Liabilities
Example
George does not have any debt so the ratio would be 0. An ideal company is one whose debt-to-equity ratio is 0, i.e., it has no long-term debt and no financial commitments to pay.
= $0 / $100,000
= 0
In case of excess debt, the company must pay off the interest on the loan and the principal amount out of profits. This reduces the dividend for shareholders or retained earnings for the company’s future growth.

Price-to-Earnings (P/E) Ratio
P/E) ratio is a metric that compares a company’s stock price to its earnings per share (EPS).
Price refers to the market price of the share, and earnings refer to the net income earned by each shareholder of the company.
Formula
P/E= Market Price of stock/Earning per share
Example
Let us go back to George’s burger Joint example, where the stock price was $100 and earnings made per share was $100.
Therefore, Price to earning ratio of Burger Joint = Market Price of stock / Earnings per share
= $100/$100
= 1.
This means for every 1 dollar George invested in Burger Joint; he earned $1 at the end of the year. P/E ratio also tells you how many years it will take to get the money back if the profit remains same.
It’s important to note that the P/E ratio can vary widely depending on the industry sector. For example, the technology sector companies, which are often high-growth, typically have a higher P/E ratio than companies in the mature sector, like banking, which generally have a lower P/E ratio. (Financial Ratio Analysis)

Dividend Yield Ratio
The Dividend Yield ratio is a metric that measures the amount of income generated by a company’s dividends as a percentage of its stock price.
The term “Yield” refers to returns.
A dividend refers to the part of the profit distributed among the shareholders.
The dividend yield ratio tells you how much dividend a share gives on its market price.
Formula
Dividend Yield = Annual Dividends Paid Per Share
Market Price Per Share
Example
In George’s burger Joint, the market price of the share was $100, and the dividend that which company provided to shareholders was $60000/1000 =$60.
Therefore, the dividend yield ratio for Burger Joint = (Dividend/Market price)*100
= ($60/$100)*100
= 60%

Price-to-Book (P/B) Ratio
The Price-to-Book (P/B) ratio is a metric that compares a company’s stock price to its book value.
The value of a company’s assets is listed on its balance sheet. In a practical scenario, it indicates if we liquidate(sell) all the assets of a company, how much will it earn?
Formula
P/B Ratio= Market Price per Share
Book Value per Share
A low P/B ratio can indicate that a stock is undervalued, while a high P/B ratio can indicate that a stock is overvalued.
These are just a few key examples of financial ratios that can be useful in different scenarios for evaluating a company’s financial health & performance.
